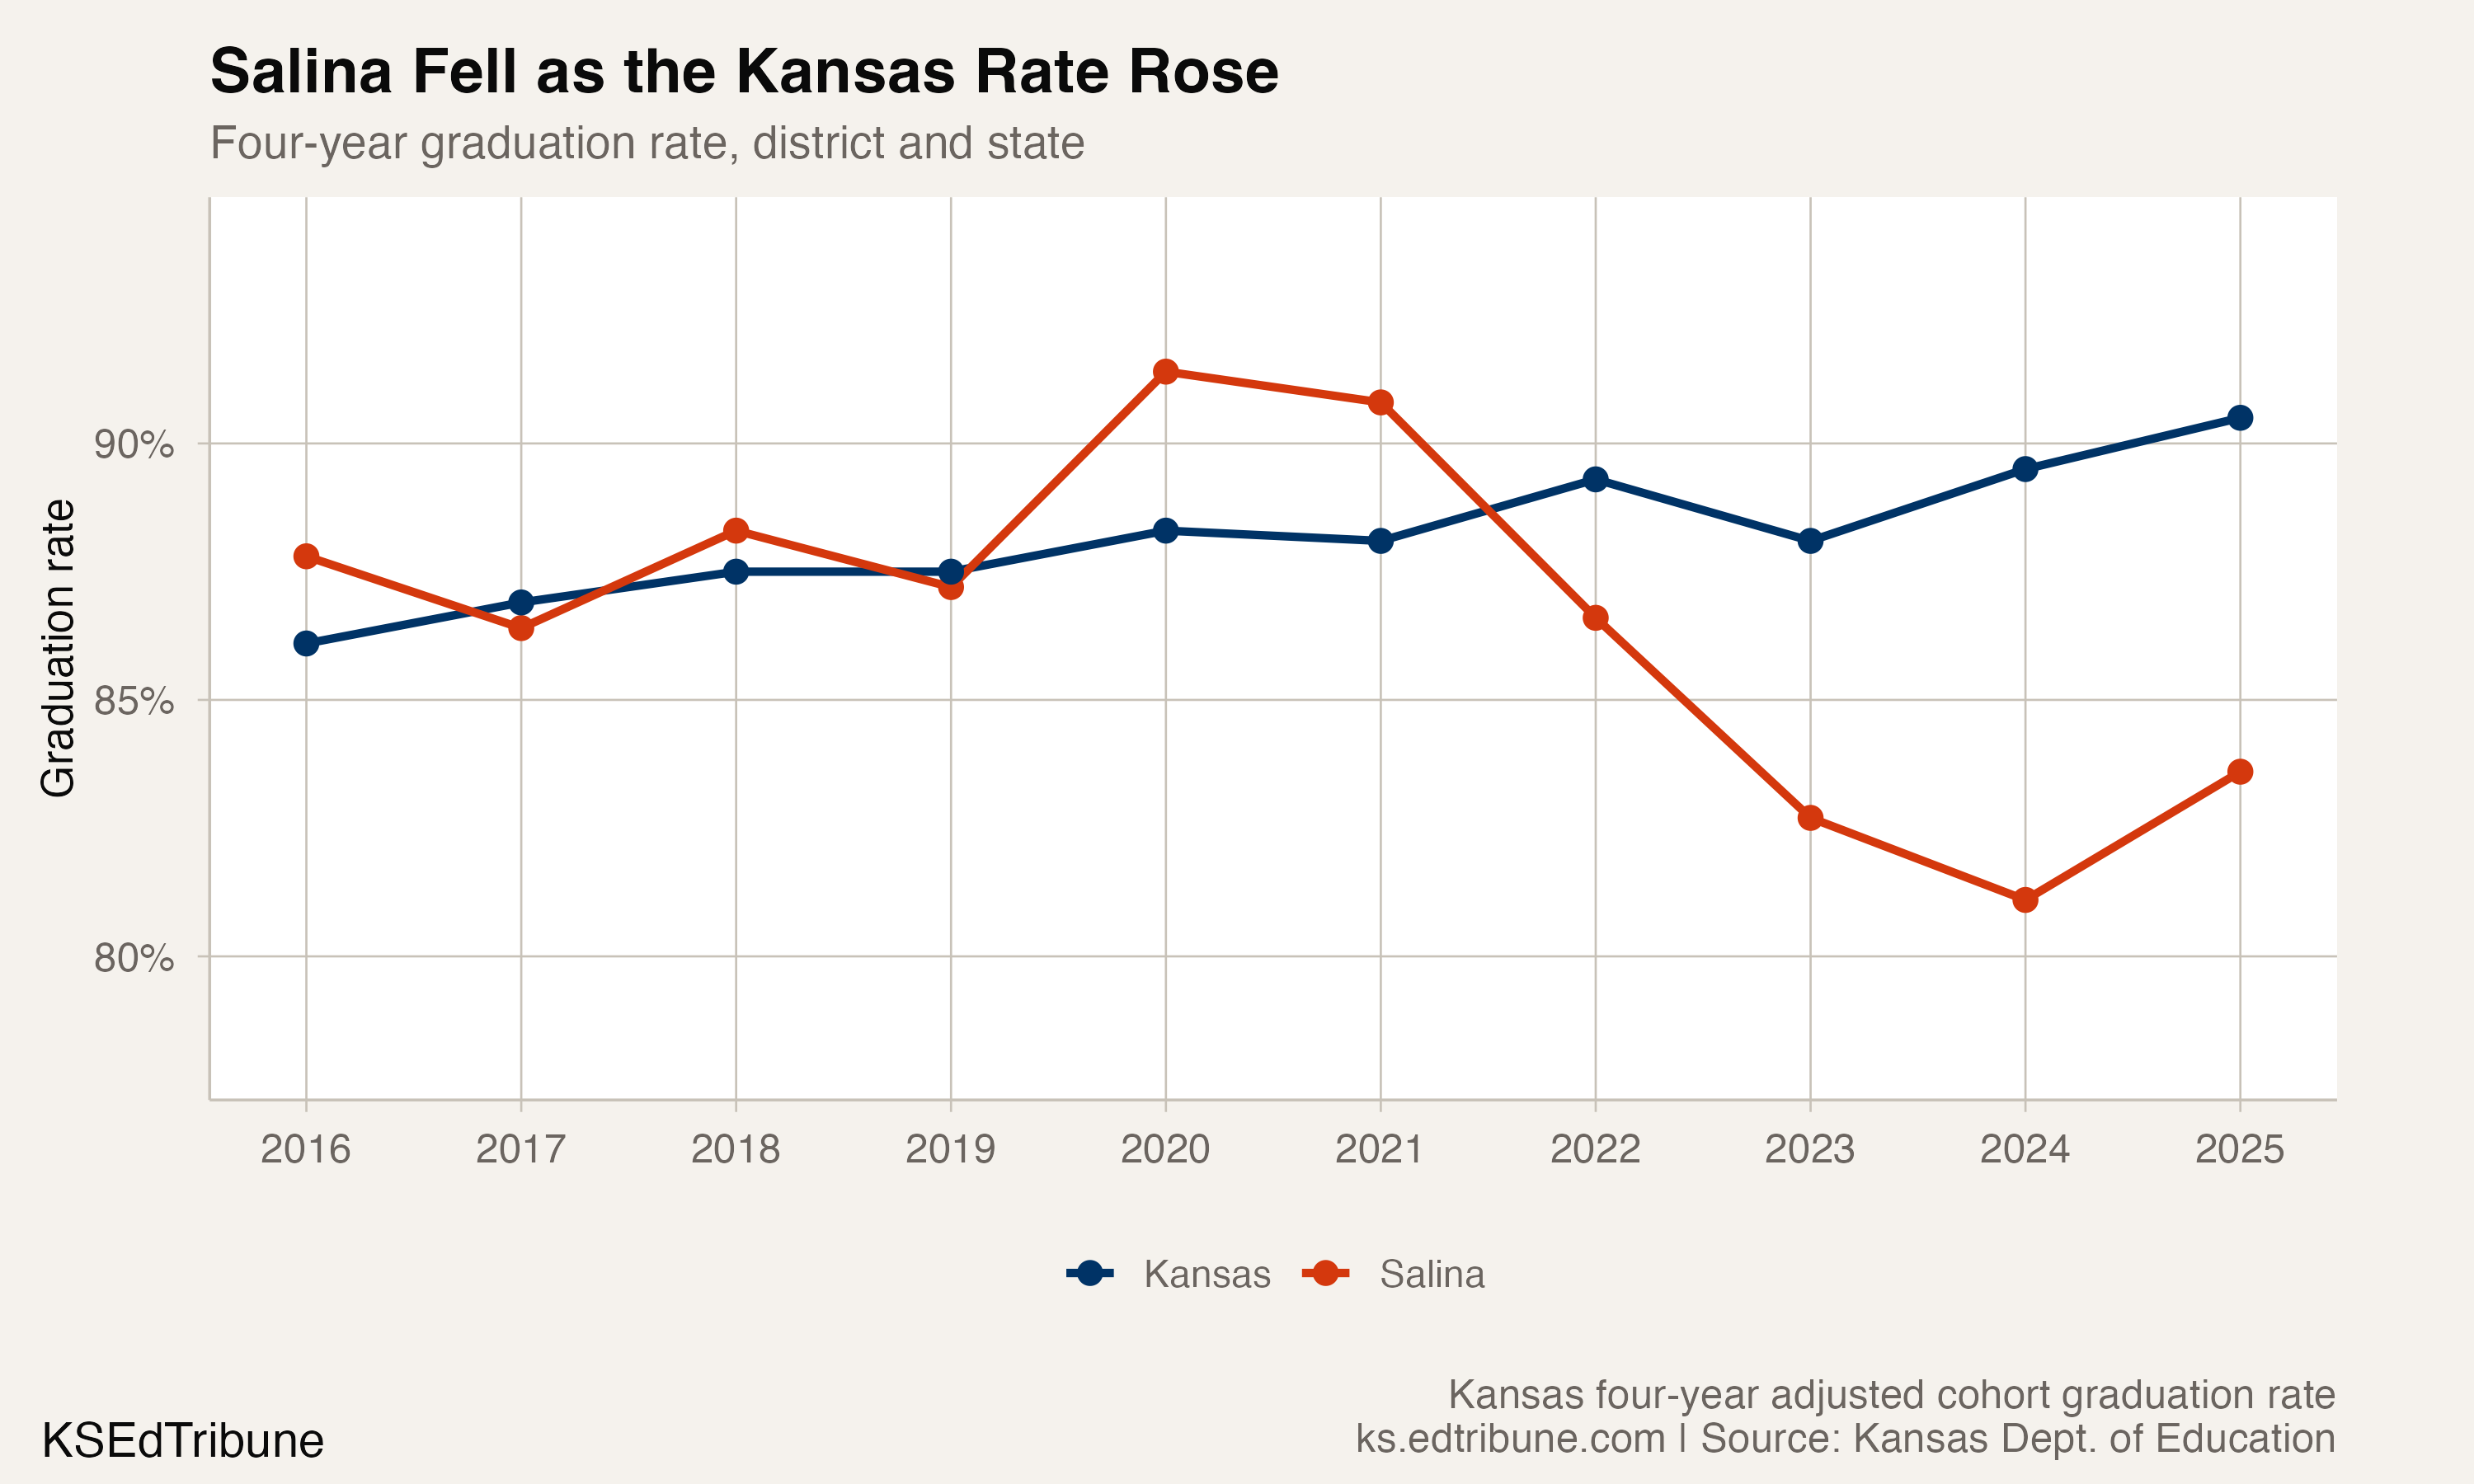
Salina↗ET USD 305's four-year graduation rate fell from 91.4% in 2020 to 83.6% in 2025. The 7.8-point decline moved the district in the opposite direction from Kansas, whose rate rose from 88.3% to 90.5%.
Salina went from 3.1 points above the state result to 6.9 points below it, a 10.0-point swing in the district's relative position.
Four declines, then a rebound
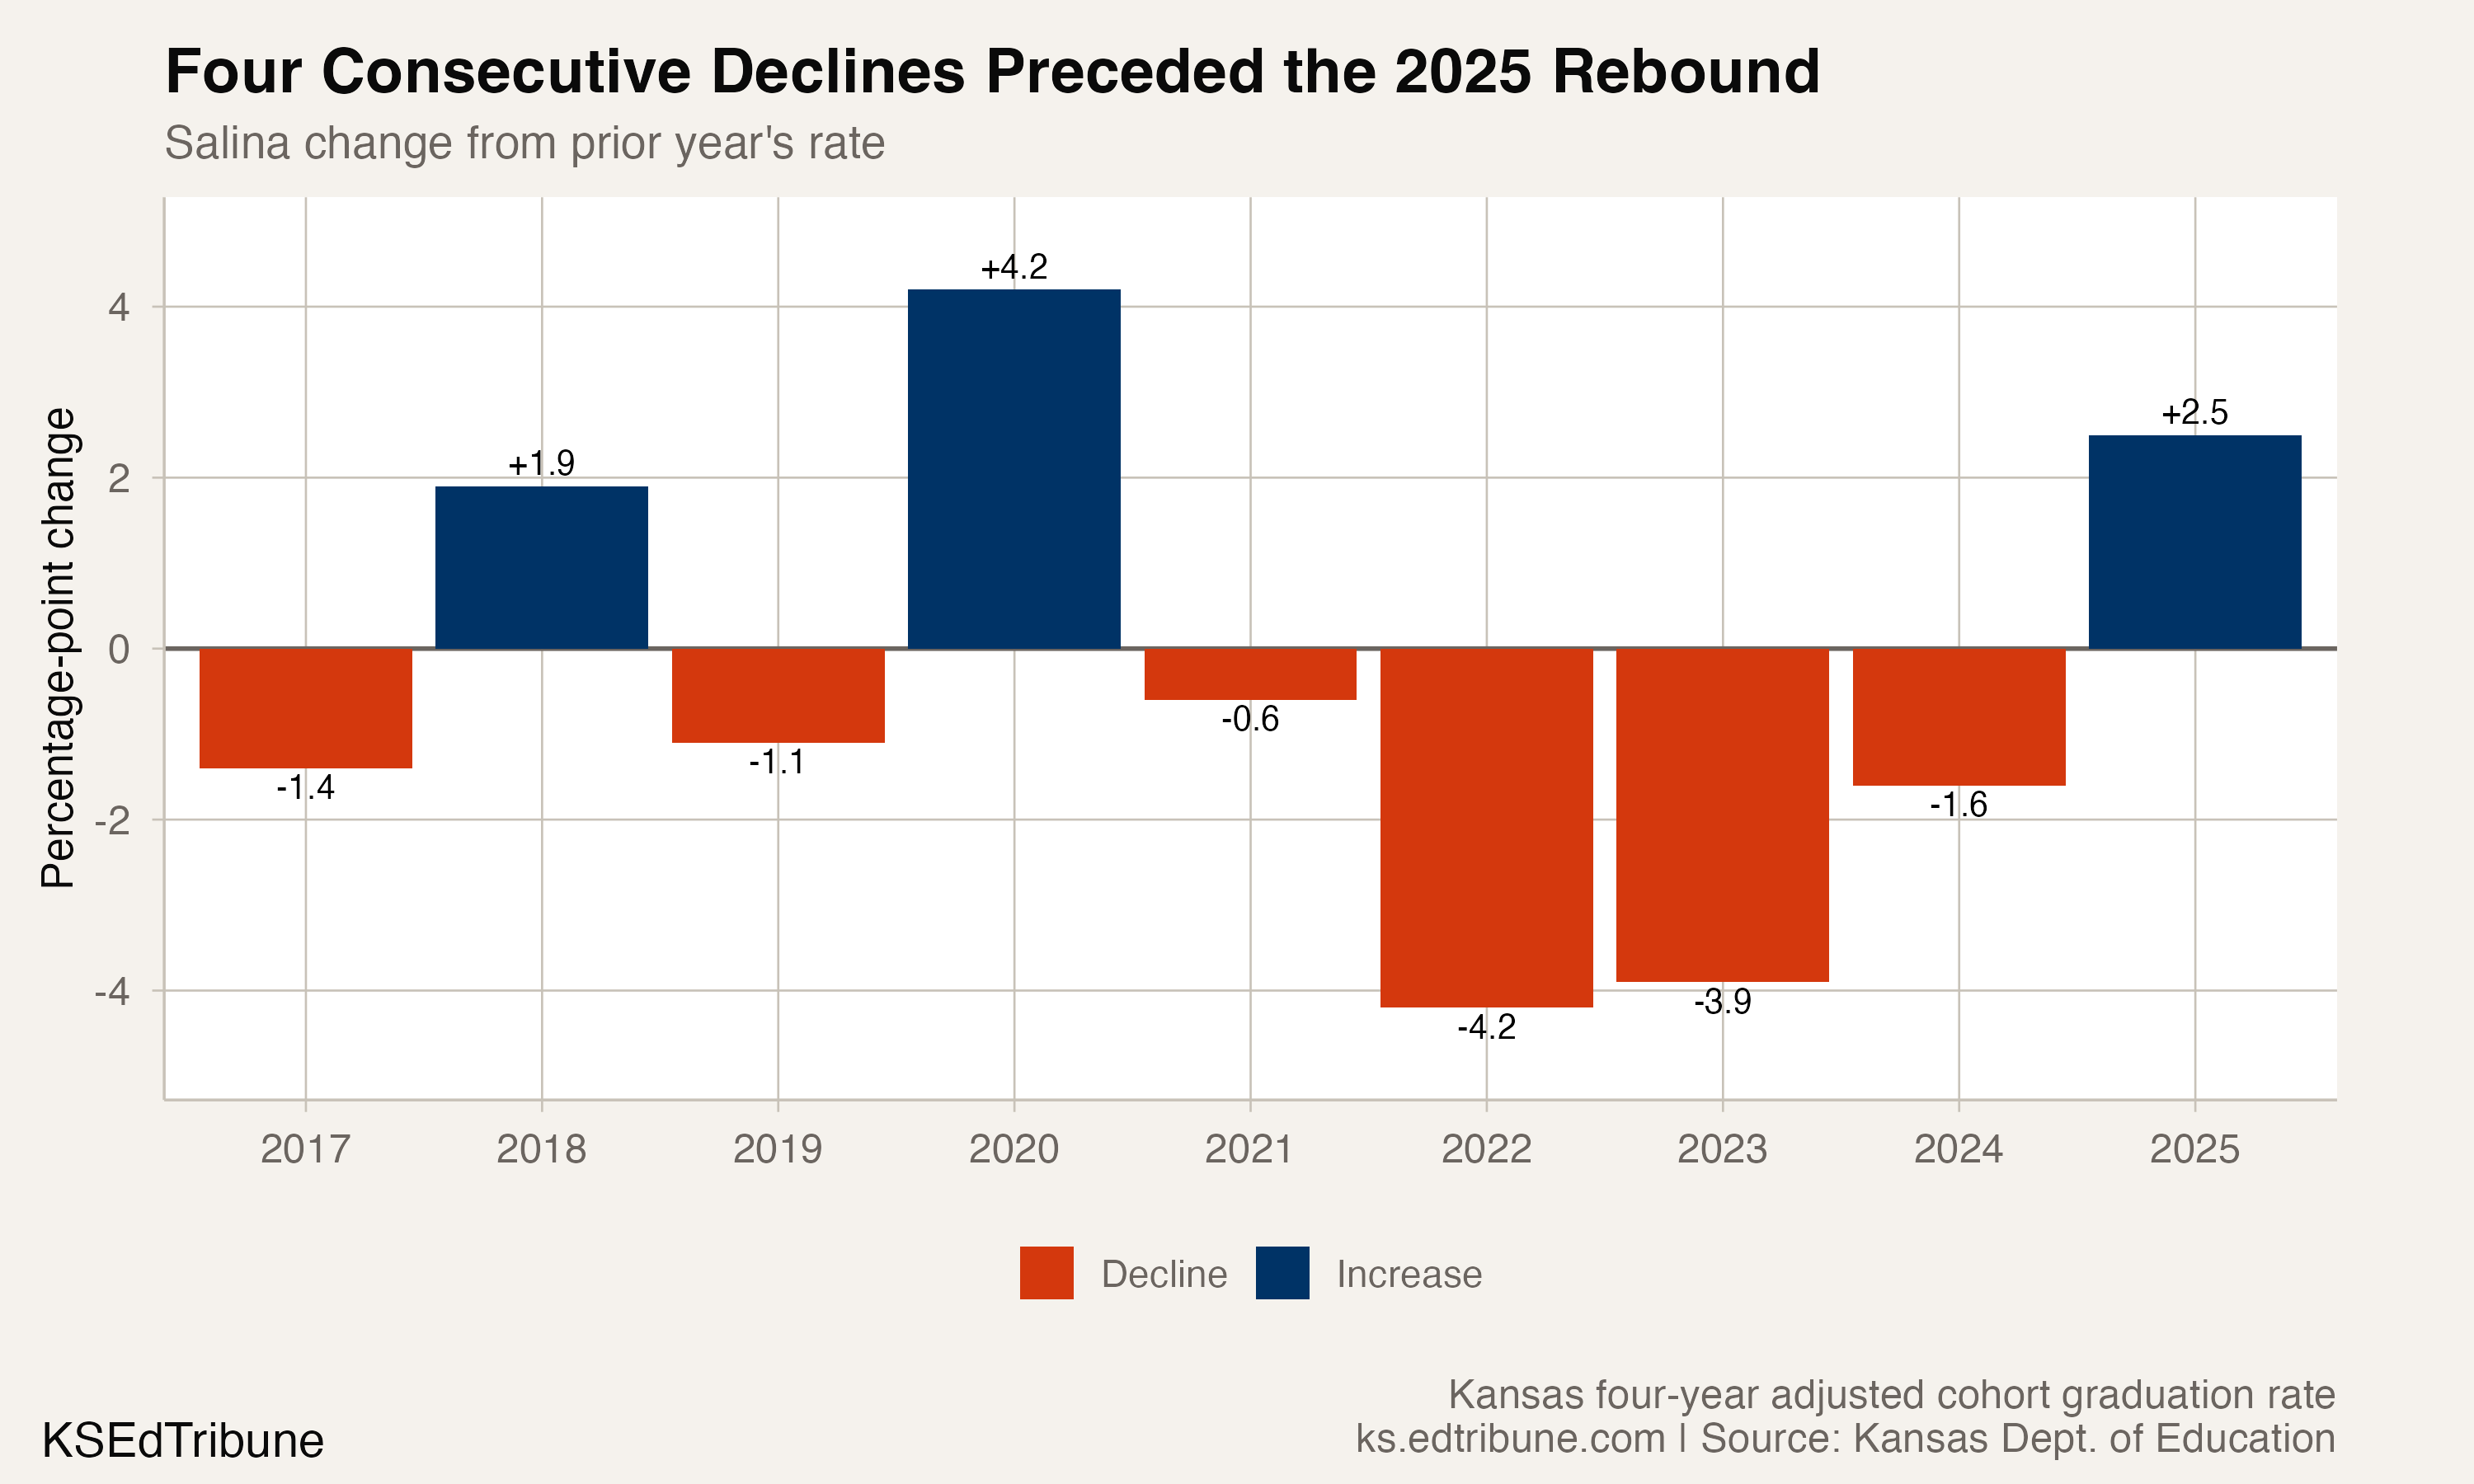
Salina's rate slipped from 91.4% in 2020 to 90.8% in 2021, then fell more sharply to 86.6% in 2022 and 82.7% in 2023. It reached a panel low of 81.1% in 2024.
The annual changes over that run were declines of 0.6, 4.2, 3.9 and 1.6 points. Together they produced a 10.3-point drop from 2020 through 2024.
The district rebounded 2.5 points to 83.6% in 2025. That gain interrupted the decline, but it recovered less than one-quarter of the preceding 10.3-point loss and left Salina 6.9 points below Kansas.
The decline was large across several peer definitions
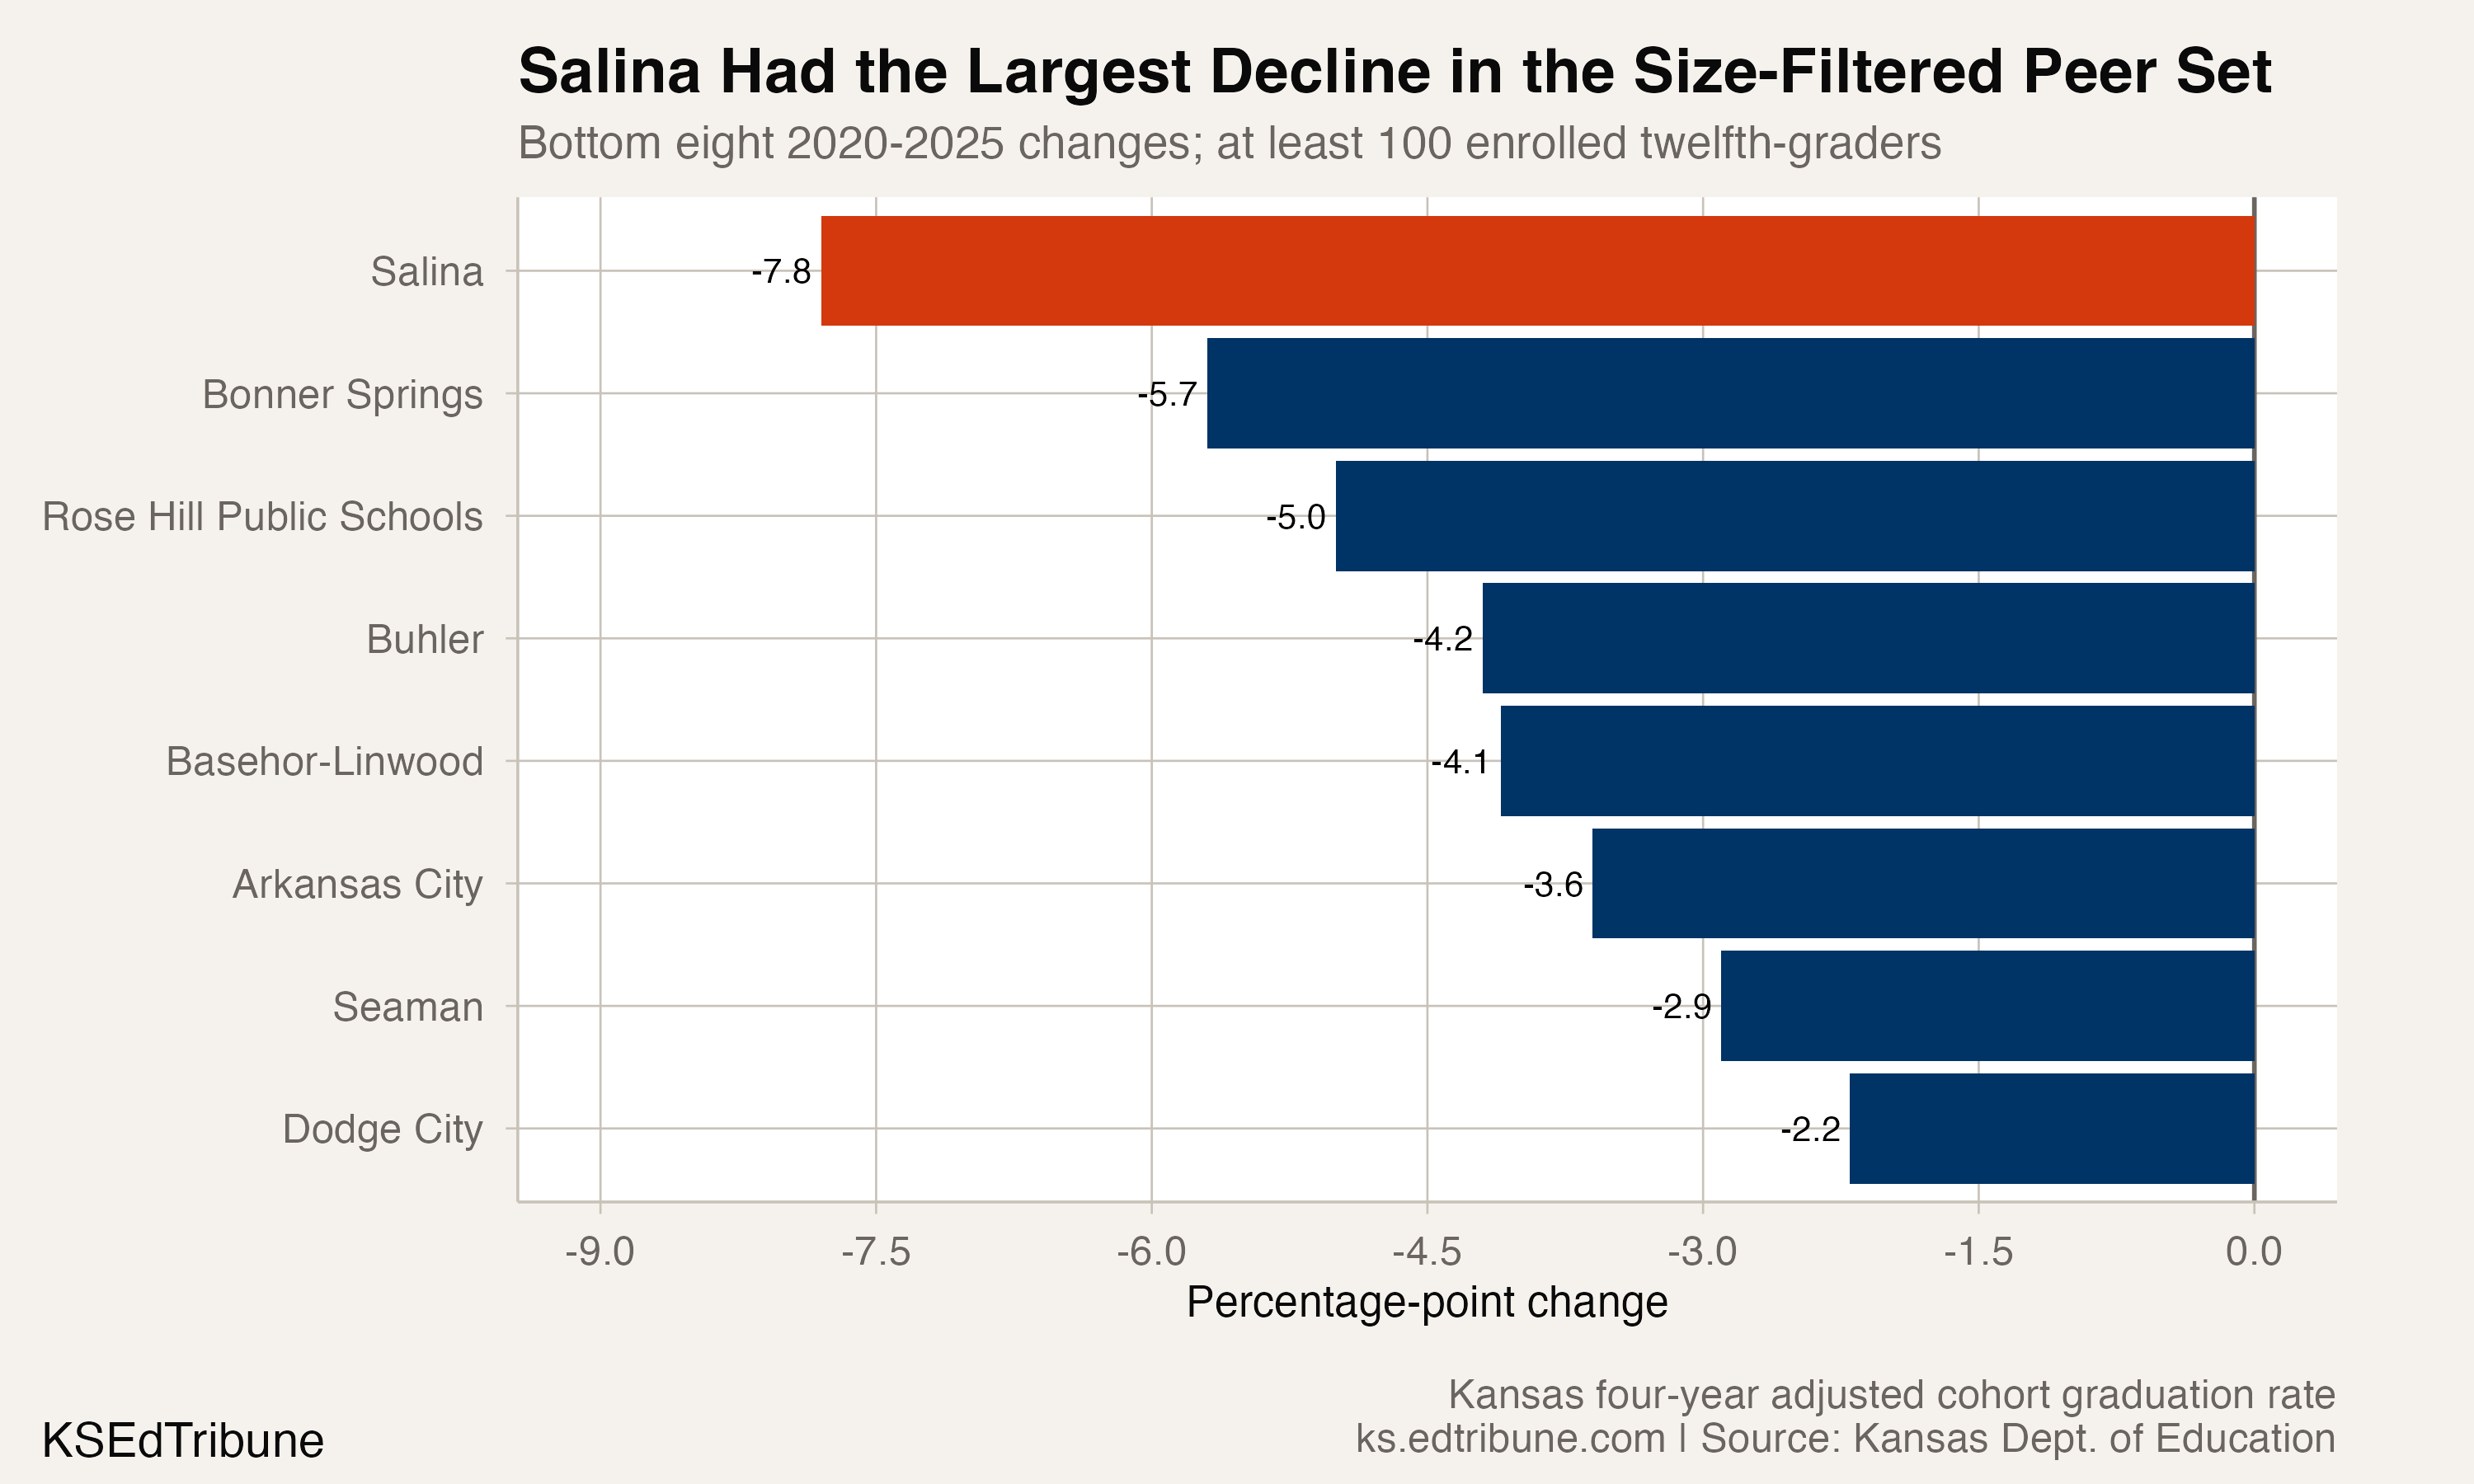
Salina reported 481 enrolled twelfth-graders in 2025. Using at least 100 twelfth-graders as a size filter yields 66 conventional districts with valid 2020 and 2025 rates. Salina's 7.8-point decline was the largest in that set. Bonner Springs↗ET was next at a 5.7-point decline.
The result persists under tighter thresholds. Salina ranked as the largest decliner among 37 districts with at least 200 twelfth-graders and among 20 with at least 400. A 500-student cutoff excludes Salina because its grade 12 enrollment was 481.
Among the 20-system set, Dodge City↗ET was the next-largest decliner at 2.2 points, followed by Goddard↗ET at 1.5 and Gardner Edgerton↗ET at 1.2.
The rates identify a problem, not its cause
The peer filter uses current grade 12 enrollment as a size proxy because the graduation package's cohort and graduate counts are empty. Virtual-school hosts and district IDs with conflicting duplicate rows are excluded from the conventional peer ranking.
The aggregate file cannot explain Salina's trajectory. Attendance, transfers, course completion, cohort composition, local programs and changing student needs could all be competing explanations. None can be assigned causal weight from these rates alone.
The measurable finding remains consequential: even after the latest rebound, Salina ended 7.8 points below its 2020 rate, 6.9 points below Kansas and with the steepest decline across multiple reasonable size-filtered peer sets.
Detailed code that reproduces the analysis and figures in this article is available exclusively to EdTribune subscribers.
Discussion
Sign in to join the discussion.
Loading comments...